TL;DR
- More training data does not automatically produce a better model – fixing class imbalance does.
- A balanced 3,472-example dataset outperformed an imbalanced 12,000-example dataset by nearly 10 macro-F1 points.
- Aggregate metrics like micro-F1 can look strong while hiding failures in rare, business-critical categories – track macro-F1 too.
- A practical rule of thumb: budget for roughly 1,000 quality examples per category, not just a bigger overall dataset.
- Synthetic data helps fill gaps, but only if it’s built to resemble messy real-world inputs rather than clean, easy examples.
More training data does not reliably improve a model – fixing class imbalance does. In one study, a 3,472-example dataset that gave every category enough examples beat a 12,000-example dataset by nearly 10 macro-F1 points. The practical guideline that follows: a model typically needs around 1,000 quality examples per category, not a bigger pile of data overall.
Why Doesn’t More Training Data Always Improve an AI Model?
The common assumption in machine learning is simple: more training data leads to better models. A recent study trained two versions of the same model – one on 12,000 examples, the other on only 3,472 – and the smaller dataset outperformed the larger one by nearly ten macro-F1 points.
More training data leads to better models.
In practice, one of the most common failure modes in fine-tuning proves the opposite.
A recent study trained two versions of the same model. One learned from 12,000 training examples, while the other used only 3,472 examples. Surprisingly, the smaller dataset outperformed the larger one by nearly ten macro-F1 points.
The reason wasn’t model architecture or optimization.It was data distribution.
The smaller dataset ensured every output category had enough examples for the model to learn, while the much larger dataset remained heavily imbalanced.
The lesson is simple:
Model performance depends less on how much data you have—and more on whether every task receives enough representation.
What Is a Long-Tail Distribution Problem in Machine Learning?
A long-tail distribution problem is when a handful of categories dominate a dataset while many others receive very little representation – common classes get learned well, rare ones barely get learned at all.
Imagine you’re building an information extraction model that identifies:
- Birthdays
- Birthplaces
- Nationalities
- Aliases
After training, the model reports 95% overall accuracy. Everything appears production-ready. A few months later, users begin reporting issues.The model extracts birthdays almost perfectly but frequently misses aliases and often misclassifies nationalities.
The model isn’t broken. The training data is.
The dataset contained over 100,000 birthday examples, but only about 1,400 alias examples.
Naturally, the model mastered the frequent categories while largely ignoring the rare ones because it never saw enough examples to learn them reliably.
This is a classic long-tail distribution problem, where a handful of classes dominate the dataset while many others receive very little representation.
Why Can Micro-F1 Hide a Model’s Real Failures?
Many teams never discover this kind of imbalance because they rely on a single evaluation metric. Micro-F1 weights performance according to how frequently each class appears, so common categories dominate the score while rare classes barely move it. Macro-F1 gives every category equal importance regardless of frequency. When micro-F1 stays high while macro-F1 drops, the model is often succeeding on common categories while quietly failing on the rare – but often business-critical – ones.
This micro-macro gap shows up well beyond information extraction, too – in a head-to-head test of two off-the-shelf extraction models, one model’s micro-F1 sat in the 65-69 range while its macro-F1 fell to just 41-44, exposing a model that handled common fields well and quietly missed the rest.
Micro-F1 vs. Macro-F1
| Metric | What it measures | Where it can mislead | When to rely on it |
| Micro-F1 | Weights every prediction equally overall, so frequent classes dominate the score | Can stay high even when rare, business-critical categories fail completely | Quick, top-line accuracy check across a full dataset |
| Macro-F1 | Weights every category equally, regardless of how often it appears | Drops sharply when rare categories underperform – which is the point | Whenever some categories matter more than their frequency in the data suggests |
Does Collecting More Data Fix an Imbalanced Dataset?
When performance drops, the instinctive response is straightforward:
Collect more training data. Unfortunately, that rarely fixes an imbalanced dataset.
If one category already represents 77% of your data and another represents only 1%, doubling the dataset simply doubles both counts. The imbalance remains unchanged.
The dominant class becomes even more dominant, while the rare class still lacks enough examples for reliable learning. The lesson isn’t that smaller datasets are better.
It’s that balanced datasets often outperform larger but poorly distributed ones.
What Happened When Dataset Size and Balance Were Compared
| Dataset | Example count | Class balance | Resulting macro-F1 outcome |
| Imbalanced set | 12,000 examples | Heavily skewed toward frequent categories | Underperformed the smaller, balanced set by nearly 10 macro-F1 points |
| Balanced set | 3,472 examples | Every output category given adequate representation | Outperformed the larger, imbalanced set by nearly 10 macro-F1 points |
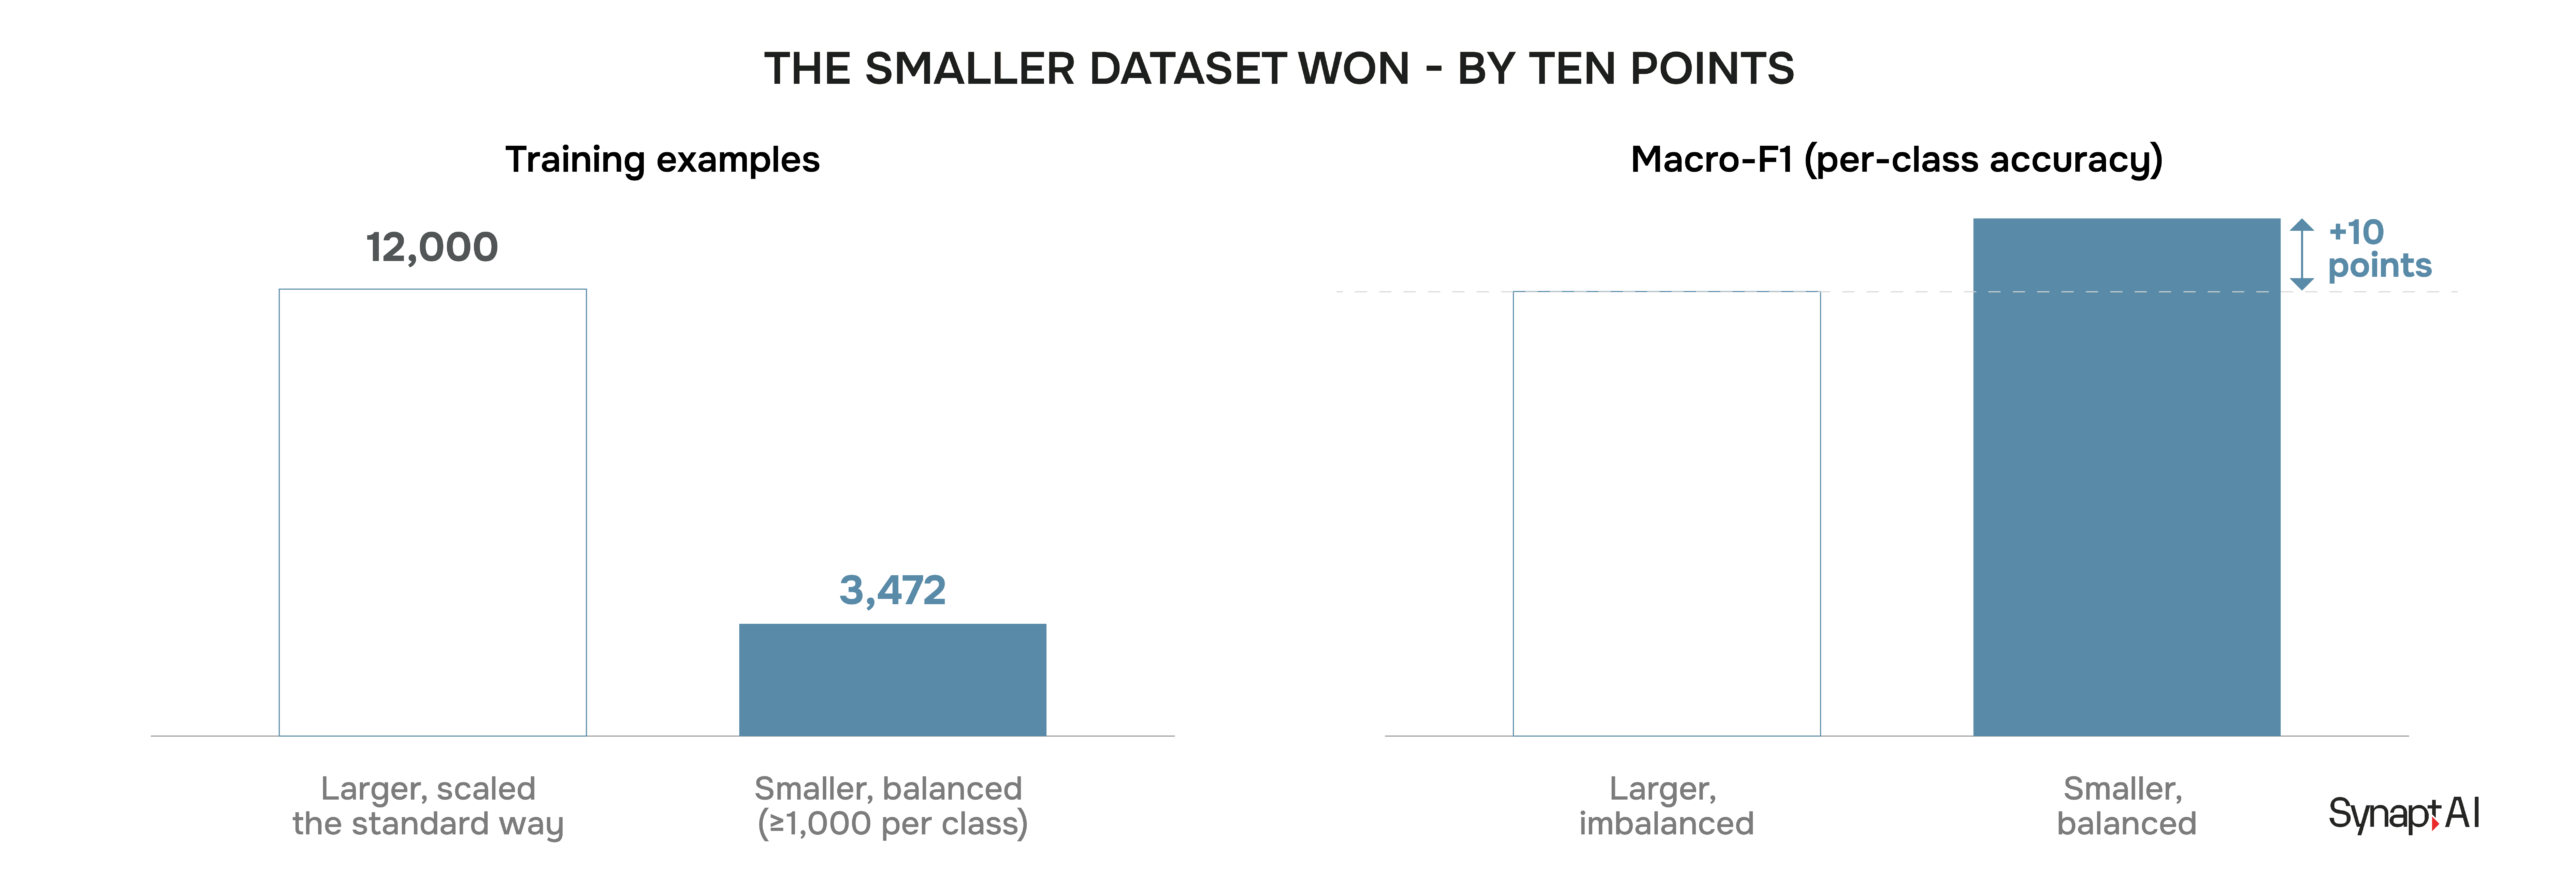
Figure 1 — A balanced 3,472-example dataset outperformed a standard 12,000-example dataset by roughly ten macro-F1 points.
What Is the 1,000-Example Rule for Training Data?
The study identified a practical rule of thumb:
A model typically needs around 1,000 quality examples of a class before it can learn that class reliably.
This aligns with research by Zeyuan Allen-Zhu and Yuanzhi Li, whose work on language model knowledge capacity suggests that models require roughly 1,000 exposures before they consistently retain and recall information.
The exact threshold varies depending on:
- Model size
- Task complexity
- Data quality
- Label consistency
But the broader principle remains remarkably consistent.
Below a minimum number of examples, no amount of architecture tuning, optimizer changes, or fine-tuning tricks can compensate for insufficient exposure.
Instead of asking:
“How many training examples do we have?”
Ask:
“Does every category we care about have enough examples?”
Those are fundamentally different questions.
Is Synthetic Data the Answer for Underrepresented Categories?
Once teams identify underrepresented classes, synthetic data becomes an attractive solution.
Modern LLMs can generate thousands of labelled examples quickly and at very low cost.
However, synthetic data introduces another problem.
Generated examples tend to be:
- Cleaner
- More obvious
- Less ambiguous
- Easier to classify
As a result, models learn decision boundaries that rarely exist in production.
One study found that models trained on synthetic data achieved 92% accuracy on synthetic test sets, but only 81% accuracy on real-world data.
The model wasn’t learning reality.
It was learning an idealized version of reality.
The choice of teacher model matters more than it might seem, too: in one distillation study, simply swapping which large model generated the training data swung the resulting student model’s performance by more than 25 percentage points.
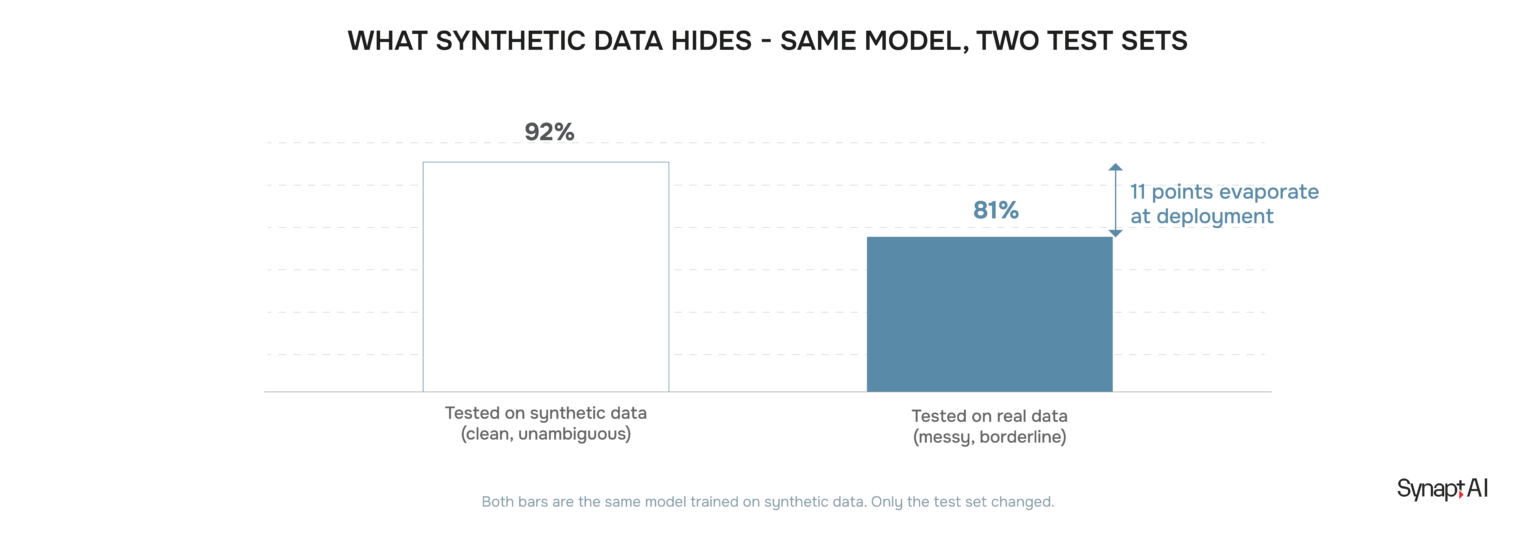
Figure 2 — Models trained exclusively on clean synthetic data perform well on synthetic benchmarks but degrade significantly on real-world inputs.
How Do You Generate Synthetic Data That Reflects Real Production Inputs?
Researchers found a surprisingly effective alternative.
Instead of generating entirely new samples, they began with real labelled examples.
Then they:
- Flipped the label.
- Asked an LLM to make only the minimal edits required to justify the new label.
These become boundary-hard examples.
Because they sit close to the decision boundary, they closely resemble the ambiguous cases real users generate every day.
Training with these difficult examples teaches the model where classifications become uncertain.
The outcome is synthetic data that better reflects production environments.
Models trained using a combination of real data and refined synthetic examples performed within 1.5 percentage points of models trained entirely on real data while demonstrating significantly stronger cross-domain robustness.
Naive vs. Boundary-Hard Synthetic Data Generation
| Approach | How it’s generated | Resemblance to real production data | Reported performance gap vs. real data |
| Naive synthetic generation | LLM generates new labeled examples from scratch | Tends to be cleaner, more obvious, and less ambiguous than real inputs | ~92% accuracy on synthetic test data vs. ~81% on real-world data |
| Boundary-hard synthetic generation | Start from a real labeled example, flip the label, make only the minimal edit needed to justify it | Sits close to the decision boundary – closely resembles ambiguous real cases | Within ~1.5 percentage points of models trained entirely on real data |
What Three Questions Should You Ask Before Fine-Tuning a Model?
Before adjusting learning rates, LoRA parameters, or experimenting with larger foundation models, ask three questions.
1. Does every class have enough examples?
If a category doesn’t have roughly 1,000 quality examples, the model may never learn it reliably.
2. Are you measuring the right metrics?
Track macro-F1 alongside micro-F1.
Aggregate accuracy often masks failures in rare but high-value categories.
3. Is your synthetic data realistic?
If synthetic examples are cleaner than production data, refine them with boundary-hard examples before training.
What’s the Real Lesson for Teams Fine-Tuning Models?
Fine-tuning often feels unpredictable because failures appear to be model problems.
Teams conclude that the model struggles with edge cases, lacks generalization, or simply isn’t powerful enough.
More often, the model is behaving exactly as it was trained.
The real issue is that some categories never received enough examples to learn in the first place.
Successful fine-tuning is less about architecture and more about data design.
Give every important class sufficient representation, evaluate performance beyond aggregate accuracy, and generate synthetic data that reflects the ambiguity of real-world inputs.
Do that, and fine-tuning becomes significantly more predictable—and far more effective in production.
FAQ's
Because extra data usually preserves whatever class imbalance already exists in the dataset. If a category was underrepresented before, adding more overall examples just gives you a bigger dataset with the same underrepresented category – the model still hasn’t seen enough of it to learn that category reliably.
It’s a practical guideline suggesting a model typically needs roughly 1,000 quality examples of a given category before it can learn and generalize that category reliably. The exact number varies with model size, task complexity, data quality, and label consistency, but the underlying principle – that categories need a minimum volume of exposure, not just the dataset as a whole – holds broadly.
Micro-F1 weights performance by how often each class appears, so common categories dominate the score and rare ones barely move it. Macro-F1 gives every category equal weight regardless of frequency. When micro-F1 stays high while macro-F1 drops, it’s usually a sign the model is succeeding on common categories while quietly failing on rarer, often business-critical ones.
Not entirely. Synthetic data is useful for filling gaps in underrepresented categories, but models trained only on clean, synthetic examples tend to learn an idealized version of the task rather than its real-world messiness. Synthetic data works best as a supplement built to resemble ambiguous production inputs, not as a wholesale replacement for real examples.
They’re synthetic examples created by taking a real labeled example, flipping its label, and asking a model to make only the minimal edits needed to justify the new label. Because they sit close to the decision boundary, they resemble the ambiguous, hard-to-classify cases that show up in real production traffic more closely than fully generated synthetic data does.
Check your data distribution before you touch the model. If an important category doesn’t have enough examples, no amount of architecture tuning, hyperparameter search, or additional overall data will reliably fix it – the fix is making sure every category you care about is adequately represented.
It’s when a small number of categories make up most of a dataset while many other categories are only sparsely represented. A model trained on a long-tail dataset tends to learn the frequent categories well and perform poorly on the rare ones, even when overall accuracy looks strong.

Subscribe to our newsletter
Insights on making enterprise AI actually work - straight to your inbox.
Subscribe to our newsletter
Insights on making enterprise AI actually work - straight to your inbox.